UI Components
深色迷你折线图
带有渐变填充、发光效果和悬停提示点的紧凑深色迷你折线图。
作者:mcpskills
框架
reacttailwind
UI 库
data
难度advanced
英文提示词
Create a premium dark-mode sparkline chart card. The card has a dark charcoal background (neutral-900), rounded-2xl shape, thin border in white/10, and subtle inner shadow. At the top left, show a small muted label 'Total revenue' and a large white number '$84,230'. At the top right, show a small green badge '+14.2%' with an upward arrow SVG. The main area is an SVG sparkline: a smooth curve connecting data points, with a gradient fill from indigo-500/20 below the line fading to transparent, and the line itself is 3px indigo-400 with a soft glow filter. Add a vertical hover indicator line and a glowing dot that follows the nearest data point. Use no emojis, only SVG shapes and gradients. The overall feel should be a high-end analytics widget.
中文提示词
创建一个高级深色模式迷你折线图卡片。卡片采用深炭色背景(neutral-900)、rounded-2xl 形状、white/10 细边框和微妙的内阴影。左上角显示小字 muted 标签 'Total revenue' 和大号白色数字 '$84,230'。右上角显示绿色小徽章 '+14.2%' 和向上箭头 SVG。主体区域是 SVG 迷你折线图:一条平滑曲线连接数据点,线下方的渐变填充从 indigo-500/20 渐变为透明,线条本身为 3px indigo-400 并带有柔和发光滤镜。添加一条垂直悬停指示线和跟随最近数据点的发光圆点。不使用 emoji,仅使用 SVG 形状和渐变。整体应呈现高端分析小组件的感觉。
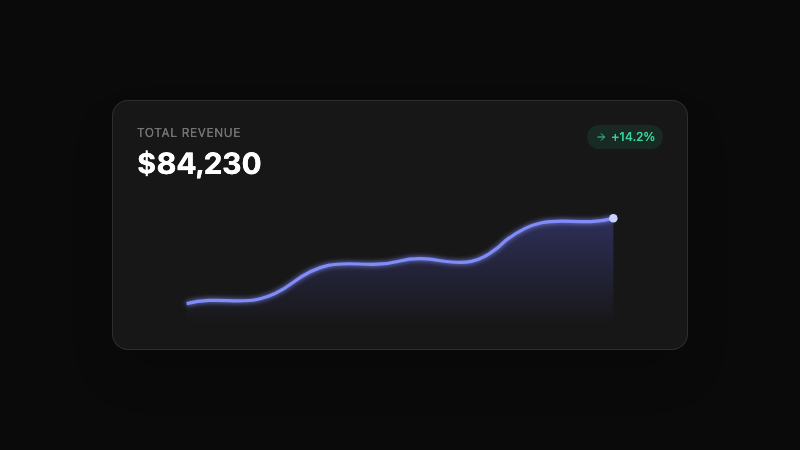
Compact dark sparkline with gradient fill, glow, and hover tooltip dot.