UI Components
活动热力图
具有圆角单元格、平滑色阶和月份标签的 GitHub 风格活动热力图。
作者:mcpskills
框架
reacttailwind
UI 库
data
难度intermediate
英文提示词
Create a premium activity heatmap component similar to GitHub contributions. Use a clean white or very light gray card with rounded-2xl shape and subtle border. Show a grid of small rounded-square cells organized by week columns and day rows. Each cell uses a 5-step color scale from very light gray/transparent to a rich emerald or indigo tone. Include a top row of month labels (Jan, Feb, Mar...) in tiny muted text and a left column of weekday initials (M, W, F) in tiny muted text. Add a legend below: 'Less' to 'More' with 5 sample squares. On hover, a small tooltip appears above a cell showing the date and activity count. Use no emojis, only SVG/CSS shapes. Make it feel clean, precise, and data-rich.
中文提示词
创建一个高级活动热力图组件,类似于 GitHub 贡献图。使用干净的白色或极浅灰色卡片,rounded-2xl 形状和细边框。展示由小圆角方格组成的网格,按周列和日排行组织。每个单元格使用 5 级色阶,从很浅的灰色/透明到浓郁的翠绿色或靛蓝色。顶部显示月份标签(Jan、Feb、Mar...)的小字 muted 文字,左侧显示星期首字母(M、W、F)的小字 muted 文字。下方添加图例:'Less' 到 'More',带 5 个示例方块。悬停时单元格上方出现小提示框,显示日期和活动数。不使用 emoji,仅使用 SVG/CSS 形状。整体应感觉干净、精确、数据丰富。
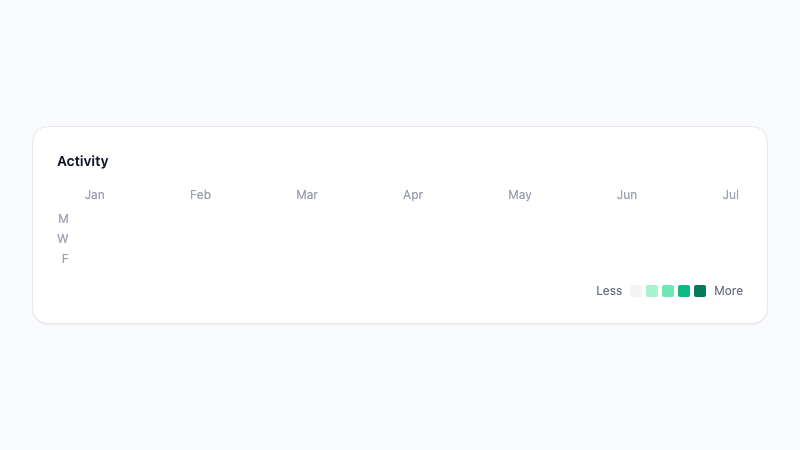
GitHub-style activity heatmap with rounded cells and color scale legend.