Dashboard
Dashboard Stats Card
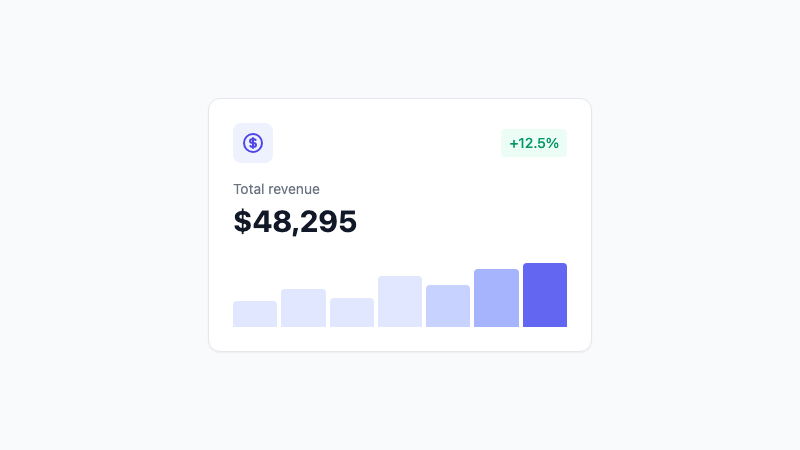
A dashboard statistics card with icon, value, change percentage, and sparkline chart.
by mcpSkills
Framework
nextjs
UI Library
shadcntailwind
Difficultybeginner
English Prompt
Create a dashboard statistics card component. It should display: an icon (use Lucide icons), a label, a main value (large number), a change percentage (with green for positive, red for negative), and a small sparkline chart at the bottom. Use shadcn/ui Card component and Tailwind CSS. Make it responsive and include hover effects.
Chinese Prompt
创建一个仪表盘统计卡片组件。应显示:图标(使用 Lucide 图标)、标签、主数值(大号数字)、变化百分比(正值绿色,负值红色),以及底部的小型迷你图。使用 shadcn/ui Card 组件和 Tailwind CSS。使其响应式并包含悬停效果。
## Overview
A reusable statistics card component perfect for dashboard layouts. Shows key metrics with visual indicators for trends.
## Features
- Icon support (Lucide icons)
- Large, readable value display
- Color-coded change percentage
- Integrated sparkline chart
- Hover animations
- Responsive grid placement
## Usage
Copy the prompt into your AI tool. The component works great in a grid layout for dashboard pages.
## Variations
Modify the prompt to:
- Add time range selector (7d, 30d, 90d)
- Include a tooltip with detailed breakdown
- Add comparison to previous period
- Support different chart types (bar, area)